Setting up PCP and Grafana metrics with Cockpit
Finding performance problems is a common troubleshooting activity. Monitoring the usage of CPU, memory, network, and other resources helps administrators to spot patterns when unusual resource usage occurs.
Cockpit can help. Let’s take a look!
Starting point
Let’s start with a pristine Fedora 34 system which has at least Cockpit 247. Everything here works in principle on CentOS/RHEL 8, Debian, and Ubuntu as well, but at the time of writing these distributions still have an older Cockpit version. Let’s make sure that Cockpit is installed, enabled, and that the port is open in the firewall, as documented on the Install page:
# rpm -q cockpit
cockpit-247-1.fc34.x86_64
# systemctl enable --now cockpit.socket
# firewall-cmd --permanent --add-service cockpit
# firewall-cmd --reload
Metrics in Cockpit for the local machine
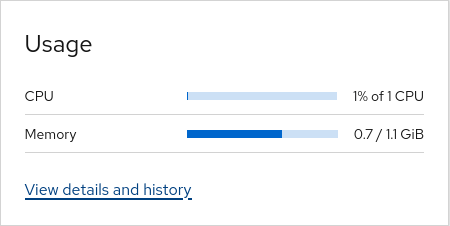
You can now log into Cockpit on https://localhost:9090, or the corresponding host name of the system which you want to troubleshoot. The Overview page shows a very brief CPU/memory usage with a “View Details and history” link:
That link leads you to the Metrics page, which in a minimal installation only shows current metrics:
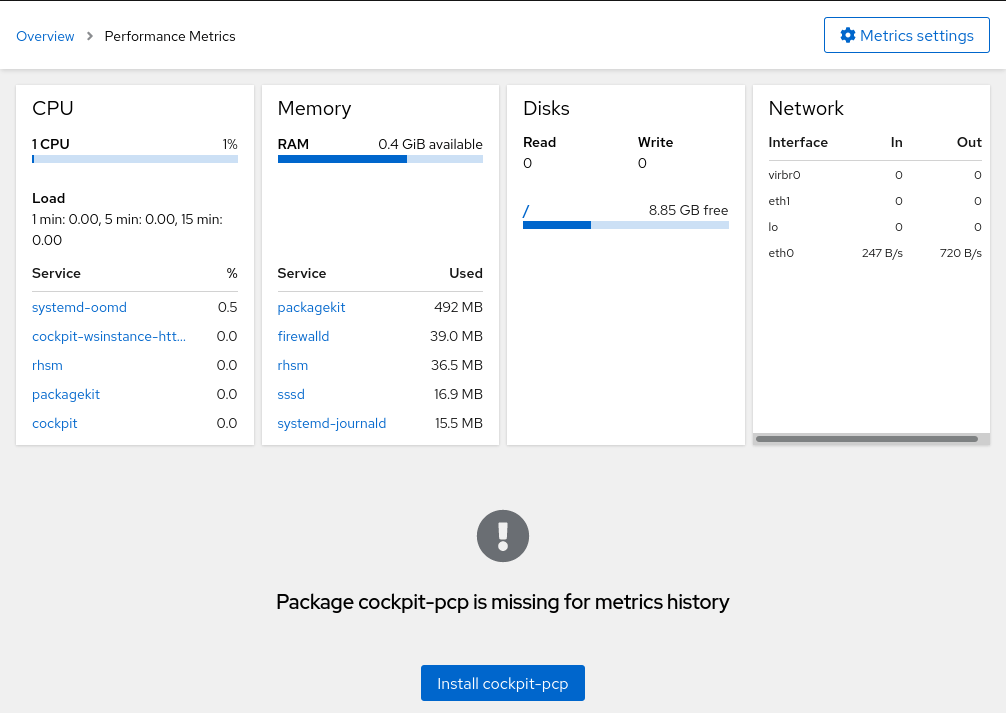
For spotting performance problems in the past, we need to enable historical metrics, which are provided by Performance Co-Pilot, aka. “PCP”.
The “Install cockpit-pcp” button installs the necessary support for this, and asks you to log in again (the newly-installed cockpit-pcp support cannot be used in an existing session). After that, the Metrics page will start to show historical metrics. Combined with Cockpit’s other pages such as “Services”, “Logs”, or “Podman containers”, this is a very powerful tool to find performance related problems:
Metrics of multiple machines
But what if you want to monitor not just one machine, but your whole fleet?
Cockpit used to have a “Dashboard” to see some basic resource usage of up to twenty machines, but this was very inflexible, inefficient, insecure, lacking important features such as alerting, and was bound to a running Cockpit session. For these reasons, the Dashboard was removed in Cockpit 234.
One of today’s industry standard solutions for visualizing metrics is Grafana; it doesn’t have above limitations. PCP offers a Grafana plugin to provide the machine’s metrics to a local or remote Grafana installation.
Setup of monitored machines
Setting up the machines for sending metrics to Grafana involves a couple of steps, which the most recent Cockpit version can do automatically for you:
- Install PCP and enable
pmlogger.serviceto start data collection. This already happened with the “Install cockpit-pcp” button above. - Enable
pmproxy.service, the PCP component which exposes a read-only metrics query API to the network. - pmproxy needs the Valkey or Redis database, so the
valkeyorredispackage needs to be installed, and the service configured to start withpmproxy.service. - pmproxy opens a network port (44322 by default), which needs to be opened in the firewall for the zone that contains the Grafana machine.
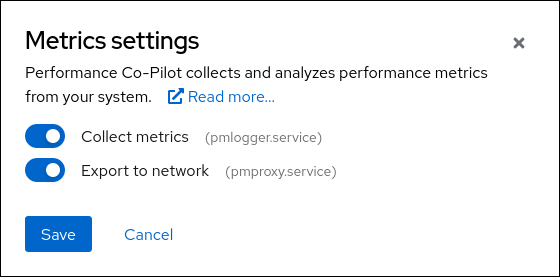
The “Metrics settings” button at the top of the page opens a dialog where you can enable “Export to network”:
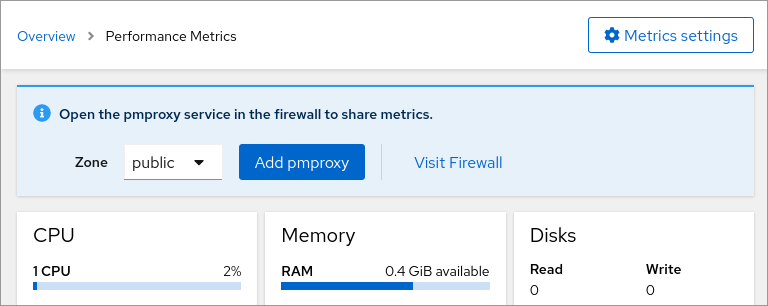
This will let you confirm any extra packages that need to be installed (such as valkey), and configure pmproxy. After that, you may get an alert for opening the corresponding firewall service (if it is not yet open in any zone):
Repeat this on all the machines that you want to monitor, or use a configuration management tool like Ansible to automate these steps.
Grafana setup
Now that the monitored machines all export Grafana-compatible PCP performance metrics, you need to install Grafana itself. This can happen on one of the existing servers, but it is recommend to install Grafana on a separate machine, or deploy it in Kubernetes.
On Fedora you can just run the distribution package:
dnf install grafana grafana-pcp
systemctl enable --now grafana-server
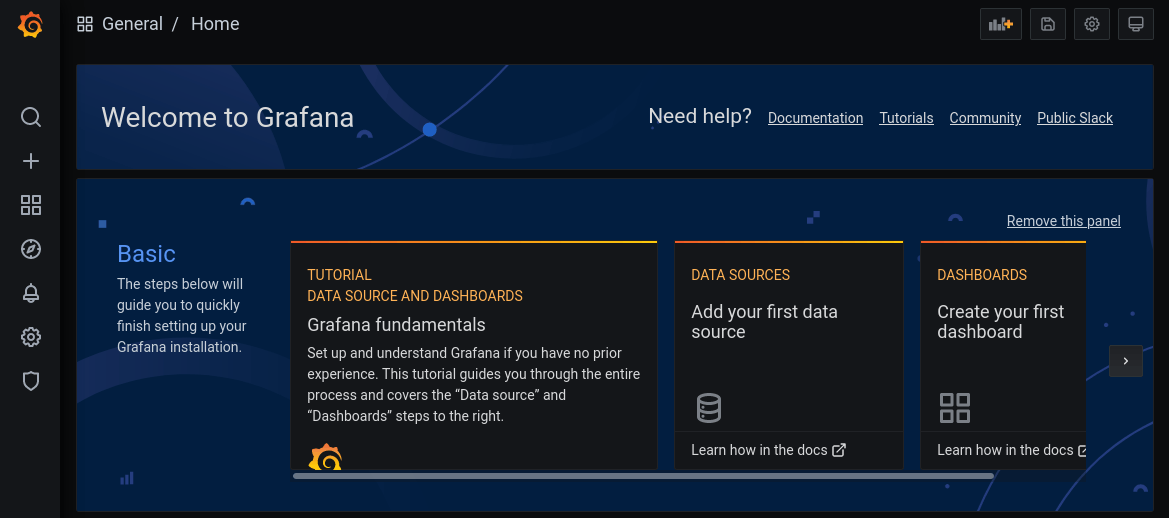
After that you should see Grafana’s login page on http://localhost:3000, or again, the corresponding Grafana host name. Log in as admin/admin for the first time, provide a real password, and you should see the start page:
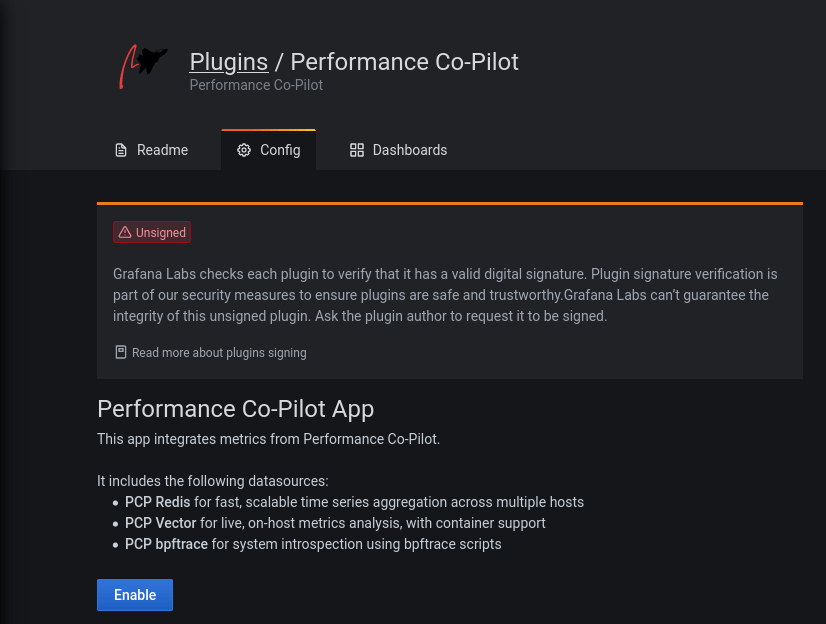
In the left menu, select the Cog wheel (Configuration) → Plugins, and enable the PCP plugin:
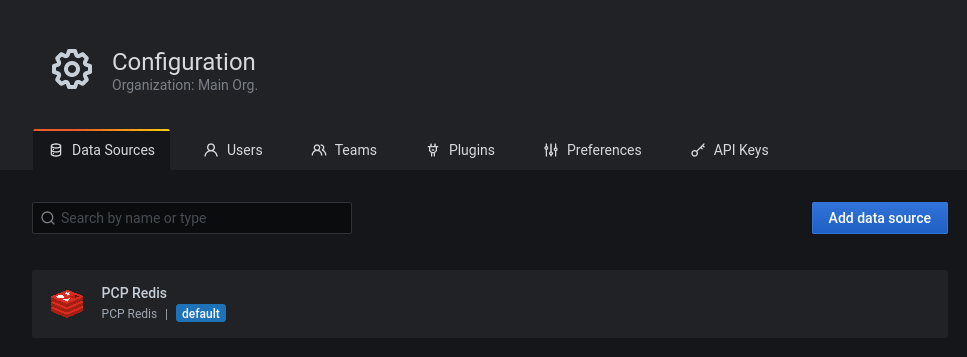
Now select Configuration → Data sources, and add a “PCP Redis” data source:
Normally you just need to enter the host name of the above machine which we configured for PCP data export:
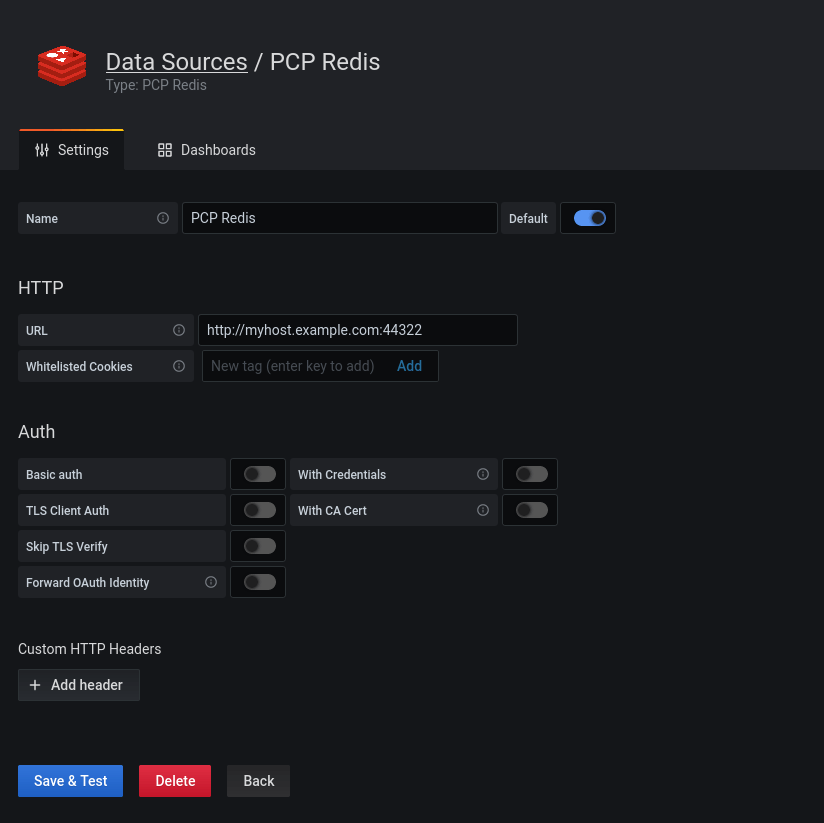
After clicking “Save & Test” you should get a “Datasource is working” confirmation. Data sources usually come with some default dashboards for an easy start. Switch to the “Dashboards” tab of that same page and import the “Host Overview”:
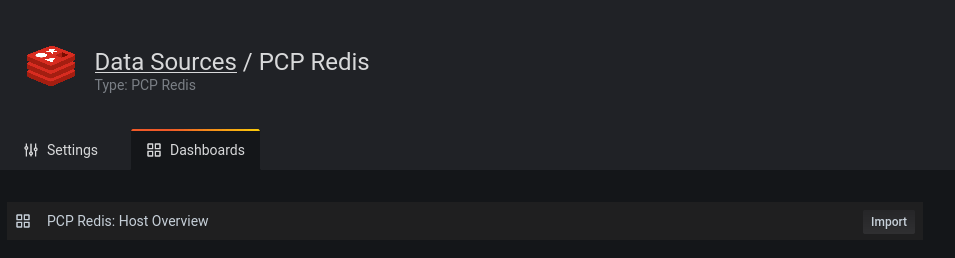
That’s it! You now have a dashboard with a lot of panels for all sorts of interesting metrics. The screenshot just shows the top ones:
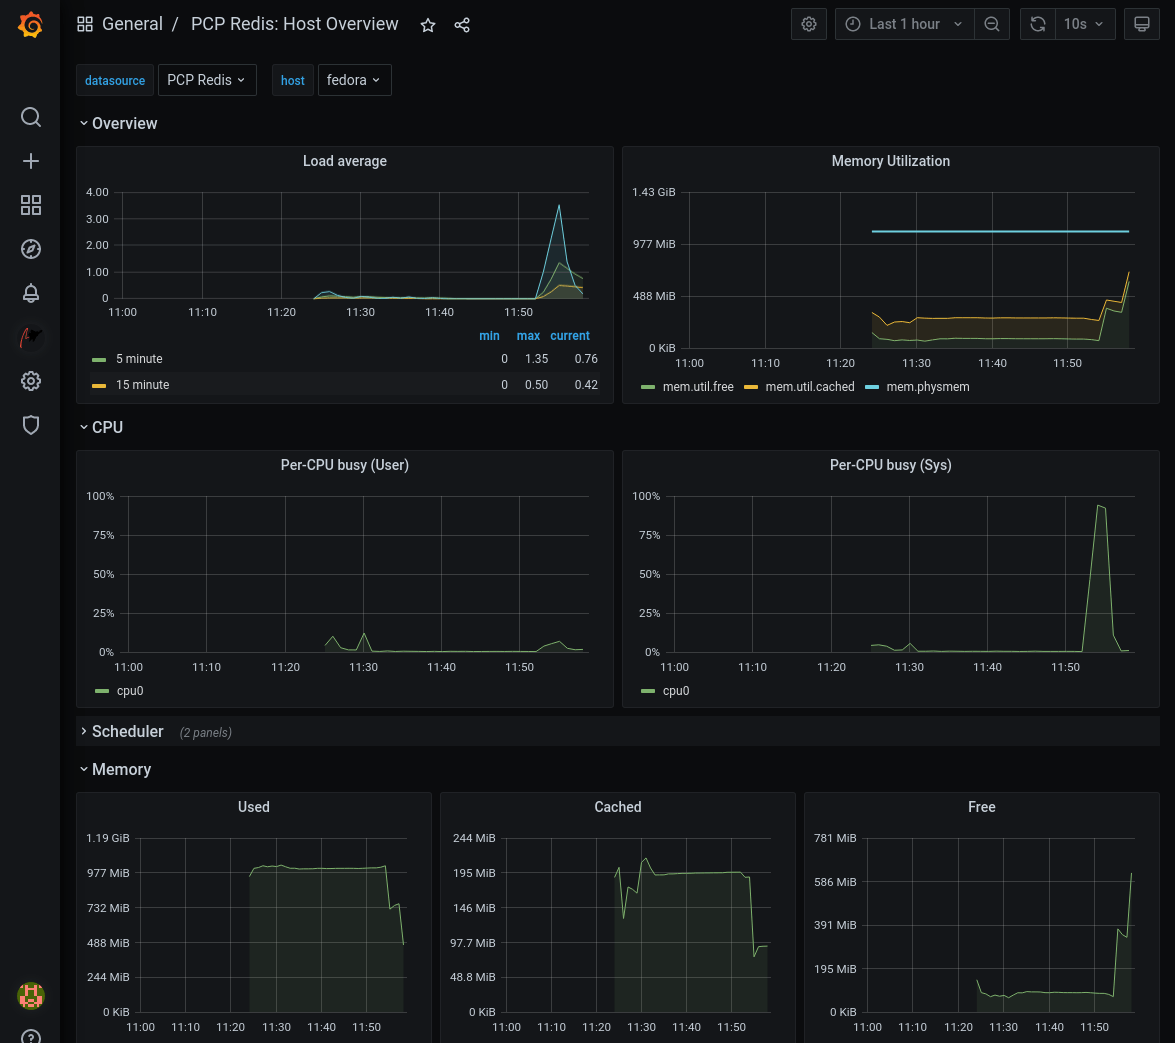
You can switch between multiple hosts, set up alerting, or adjust the panels to your liking.
Happy performance debugging!