CI Metrics and Error Budgets
The Cockpit project literally lives and dies together with our integration tests and the CI machinery to run them. We notice this the hard way whenever there is an outage; that’s why we invested quite some efforts to run tests on at least two different clouds, and fall back to Amazon EC2 when needed.
But there is a wholly different version of that pain: When tests or the infrastructure slowly become worse. At first it’s just a single “oh, a red test, this is unrelated, let’s just retry”, and before you know it it takes a day to get a pull request to green, and developers get frustrated and even afraid of touching tests.
Error budget
With our tests and CI machinery being such important tools, we need to constantly measure their current state and quality to detect when they become too bad. In that case it is better to immediately react, stop feature development, and fix up our tools until they are in shape again. In total this minimizes the unnecessary pain and time spent on pull requests to get along with or work around breakage.
The goal is to turn a vague gut feeling into objective numbers and alerts. This helps your own team to stay honest, be transparent to colleagues, users, and management, and also to invest the right amount of work into infrastructure. The latter point is crucial – clearly you can spend too little work and end up with a tool which is more of a hindrance than an aid. But you can also spend too much work on it, just because it’s fun, or you are a perfectionist, ending up with diminishing returns.
This approach is called an error budget and described in all of its details and consequences in the free Google book Site Reliability Engineering. This principle is mostly applied for services towards external customers, such as a web application or cloud engine. But we realized that it equally well applies to our development team as an internal service – we are just our own customers, with two different hats: Most of the time we develop Cockpit, but sometimes we switch roles and develop our infrastructure.
Define Service Level Objectives
The first step of that story is to sit down with the stakeholders – in this case our own development team. We discussed our high-level expectations on our development process, and agreed that we are “happy” as long as these hold:
- PRs get validated in a reasonable time (queue + test run time).
- We don’t waste time on interpreting unstable test results.
- We are not afraid of touching code.
- Test failures are relevant and meaningful. Relieve us from having to decide about “unrelated or not” every. single. time.
As stated, these expectations are not objective; they need to be translated into concrete and measurable “Service Level Indicators” (SLI), together with a definition which range of an SLI we consider as “good”/”keeps us happy” according to the abstract expectations above. The latter is called a Service Level Objective (SLO). For us they look like this, in descending importance:
- A merged PR becomes fully green with a 75% chance at the first attempt, and with a 95% chance after one retry.
- Every individual test succeeds at least 90% of the time.
- 95% of all PRs are merged without failed tests.
- 95% of test runs take no more than 1 hour to execute.
- 95% of test runs spend no more than 5 minutes in the queue until they get assigned to a runner.
- 95% of scheduled tests run through to completion (all tests ran and status got reported to PR).
These levels are not very ambitious compared to five nines that are often required in other places. We intentionally started low to get a grasp of how an error budget works. These SLOs represented a challenge which was achievable with a realistic amount of effort, while being good enough to not hamper our Cockpit development life.
We published these SLOs on our wiki to generate a sense of commitment and transparency.
Implement Service Level Indicators
Now comes the time to meet the hard reality – to pry these numbers out of production CI. Fortunately, most of the above SLIs (all but #2) can be derived directly from the GitHub Statuses history. For example, #5 is the time between “Not yet tested” and “Testing in progress” status changes, while #4 is the time between “Testing in progress” and any final (success, failure, error) status.
Only #2 requires scanning the actual test logs; our logs are in TAP format, which makes it easy to scan for lines starting with ok or not ok and reading the test name and retry attempt/reason after that.
This evaluation happens in the store-tests bots script. This gets called through a webhook for each merged PR. We deliberately do not count failures or long tests from intermediate force-pushes or abandoned PRs, as during that phase pretty much anything can (and does) go wrong. However, GitHub statuses do record test retries (for SLO #1).
store-tests puts its results into an SQLite database which gets published on our logs server.
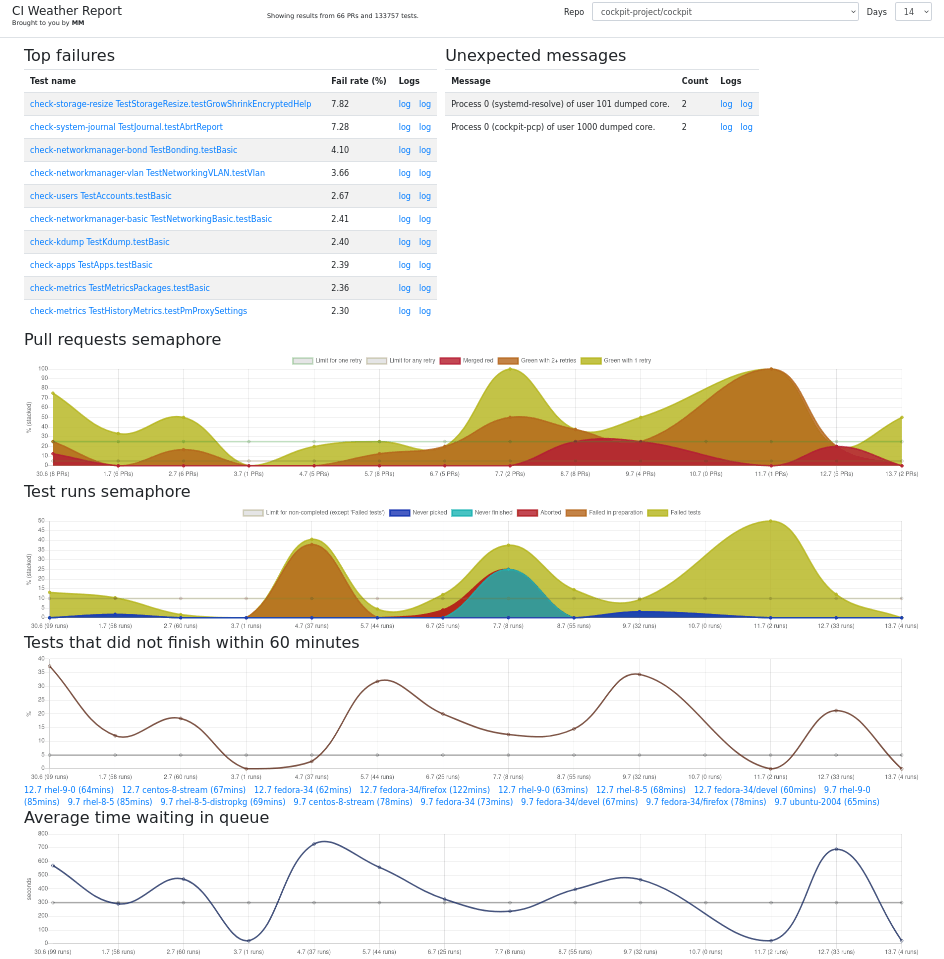
Visualizing SLIs and SLOs, take #1
To present the numbers in the database in a human friendly form, we started out with an “all-in-one” tests.html. This uses sql-wasm to directly read the above SQLite database URL and the chart module to plot graphs. This got called the CI weather report. The ingenious thing about it that it requires zero additional infrastructure and moving parts, and it has selectors and per-test subpages to drill down into any desirable detail. The major drawbacks are that it is really slow – each page update needs to fetch the database again, which by now has swollen into a ~ 40 MB blob; and making changes to it is rather hard, as it involves a lot of coding.
Moving to Prometheus/Grafana
We recently got a requirement to combine our metrics with those of other teams, to get a high-level overview of the status of various RHEL teams. That just wasn’t possible with the hand-woven all-in-one html. Due to that and the shortcomings from above, we moved to the industry-standard solutions.
Prometheus collects metrics from an arbitrary number of sources, stores them in an internal database, and offers the PromQL query language and API for generating time series, statistical calculations, or making predictions. Data sources need to export metrics in a fairly straightforward text format, so we wrote a prometheus-stats script which queries them from the same SQLite database, computes the metrics, and writes the Prometheus metrics to stdout. Our production metrics get exported on our logs server, but they are easy enough to generate locally as well in a bots repository checkout:
$ curl -O https://logs-https-frontdoor.apps.ocp.ci.centos.org/test-results.db
$ ./prometheus-stats
# HELP queue_time_wait_seconds histogram of queue wait times
# TYPE queue_time_wait_seconds histogram
queue_time_wait_seconds_bucket{le="300"} 1720
queue_time_wait_seconds_bucket{le="3600"} 2567
queue_time_wait_seconds_bucket{le="+Inf"} 2646
queue_time_wait_seconds_sum 2438358
queue_time_wait_seconds_count 2646
[...]
Grafana builds graphs, dashboards, and alerts from Prometheus/PromQL. They are much easier and faster to create and iterate on than the static code from take #1. Grafana also offers variables, selector dropdowns, and time range selectors, so that you can restrict the view to a particular project repository only, or can switch between a recent view (last 24 hours) or a long-range evolution (like 30 days). However, this is not done yet: Compared to the weather report, you can’t drill down into individual test case failures, nor get links to example logs.
We deploy Prometheus and Grafana to our Kubernetes cluster on CentOS CI. The resources, deployment scripts, and pre-defined dashboards live in our Cockpituous infrastructure repository.
There are currently two Dashboards defined: Cockpit CI shows the straight SLIs and unstable tests, plus some extra information like how much space our test VM images use on S3.
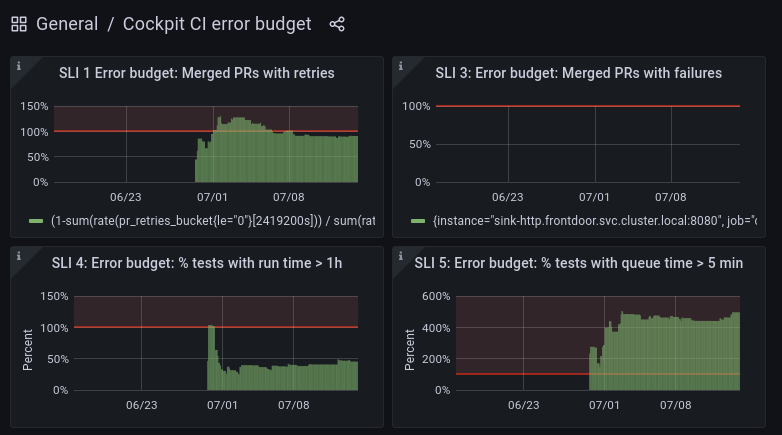
Recently we also added a more abstract Error Budget dashboard, which shows the SLIs with a focus on and normalization to the defined SLO error budgets:
Drawing conclusions
This error budget view now can guide our activity in an objective way. For example, a value of 50% like on “SLI 4: percentage of tests with runtime > 1 h” means that for that particular SLO we used up half of the error budget. The SLO is “95% of all tests take no more than 1 hour to execute”, so the error budget is 5%, and the graph tells us that currently roughly 2.5% of tests take longer than one hour. That metric can still become twice as bad before we have to stop the line and go into “infrastructure is on fire” mode.
On the other hand, “SLI 5: percentage of tests with queue time > 5 minutes” is way beyond the budget. The detailed graph tells us that it’s not actually that bad, the average queue time is 5.17 minutes – just slightly off. We used to have a queue time of a few seconds, so in our case this is an actual bug. We actually know the cause of that – it will take a few hours to debug, but the details are not important for this post.
But for other cases, it could just be that the queue time has been like that for months, and nobody was bothered by it – in that case it may be appropriate to redefine the SLO, and bump it to 10 minutes. The initial SLO was defined by gut feelings and polls as well, after all, and they should regularly be reviewed against the team’s opinion whether they still accurarely represent “happiness”.
Next Steps
Our current state is a good foundation, but we are not done:
-
There are no alerts yet. Grafana has alerting support, but I have not looked at this at all. We want our infrastructure maintainers to get an email, and/or possibly an IRC bot message.
-
Compared to the weather report, the biggest missing feature in our Grafana boards are links to example test runs which violate the SLOs. The OpenMetrics format promises support for “exemplars” which fit exactly that use case, so we need to change our export accordingly, and figure out how to represent them in Grafana.
- We need to define and follow a process how to react to exceeding the error budget:
- How many/which team members stop working on regular projects to move to infrastructure fixing?
- How does the team do a retrospective to determine why the error budget was exceeded?
- Once we fix the problem, it will take some time for the usual “28 days” view to abate and leave the alert zone, even though the problem is fixed; how do we represent that in the default view? How do we communicate this to other teams?
- There are now two databases involved: Our own SQLite one, and Prometheus. It feels like it should be possible to get rid of our own one somehow, but computing the metrics does require a certain look-back window. It may be possible to simplify this once we retire the static weather report page.